MagicChart in depth
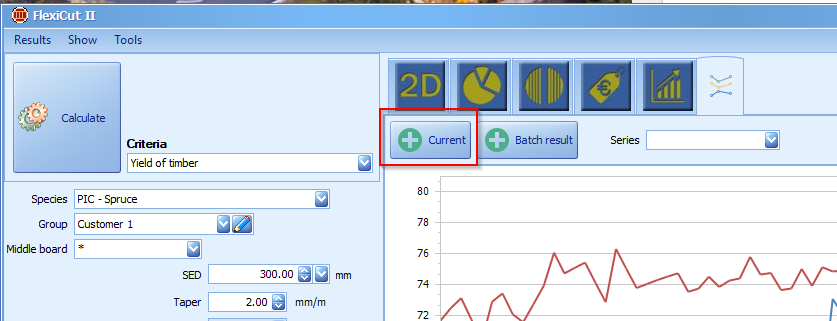
MagicChart is new feature in CutLog software. It gives user ability to compare various input parameters and its affecting to optimization result. for example base on product range for two customers can be compared timber yield for range of small end diameters:
Each chart whithin MagicChart can be counted base on different input values for optimization:
- different sawblade thickness
- different production
- different sawlog length
- completely different technology
So in case of investment into the new technology or upgrading current one, you can compare benefit of it very quickly.
It is very easy and fast to create chart. In the following example each Customer has different products. It means different timbers for optimization.
We are implementing MagicChart into FlexiCut2 optimization first, because FlexiCut2 is the most versatile and appropriate for all technologies today!
But in future it will be possible to use it also in other optimization functions.
If you want to use CutLog in your company, you can download and test it for free. Also in case of interest, contact us for ordering. See links below for additional information
Analyse of yield base on diameter - Blog

Free download of timber sawing optimization software
Enter your text here ...

Price of timber sawing optimization software
Enter your text here ...
Deprecated: strpos(): Passing null to parameter #1 ($haystack) of type string is deprecated in /web/htdocs/www.cutlog.com/home/www/administrator/components/com_easyblog/includes/blocks/handlers/image.php on line 262
By accepting you will be accessing a service provided by a third-party external to https://www.cutlog.com/